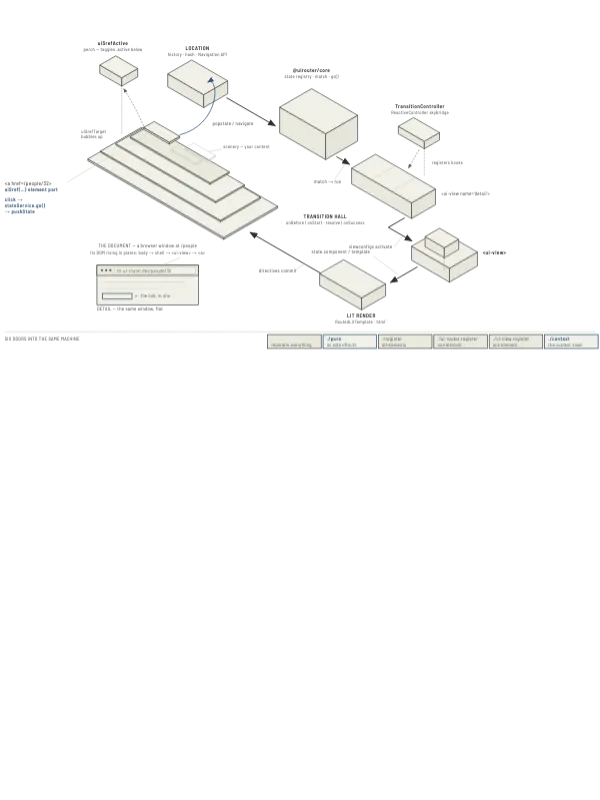
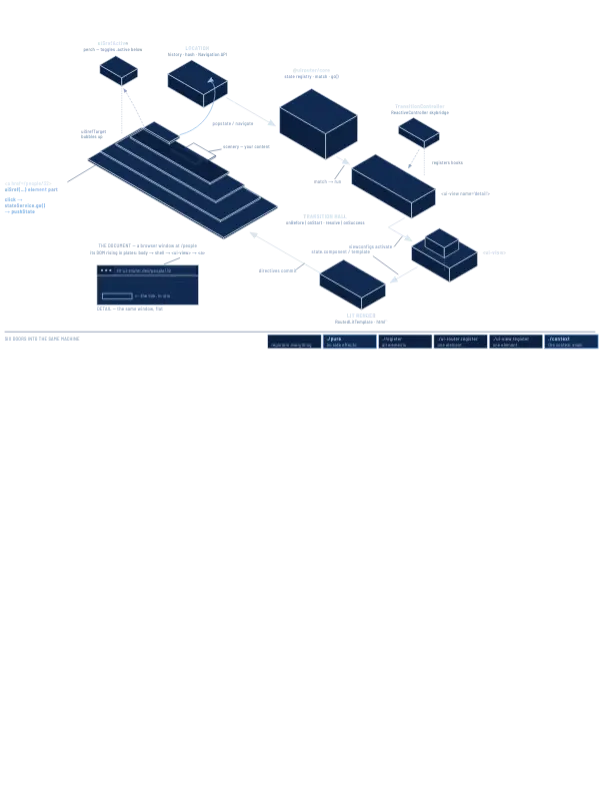
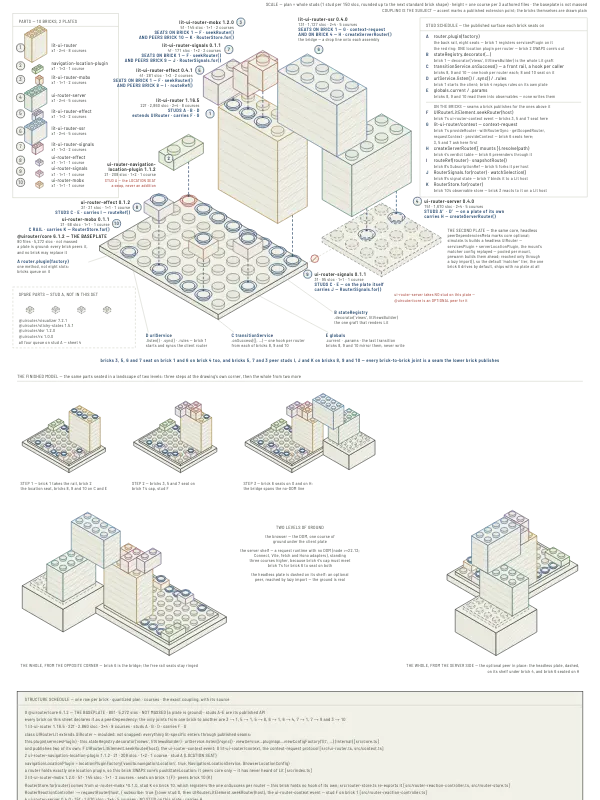
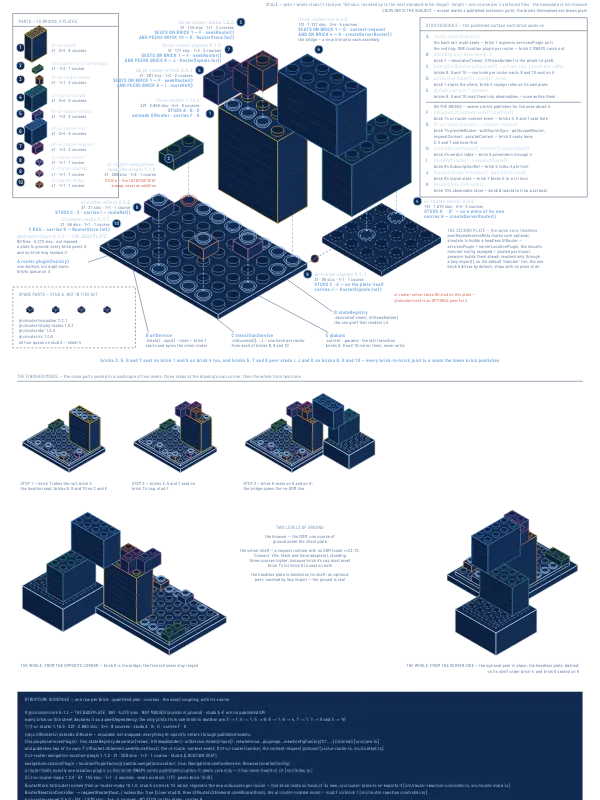
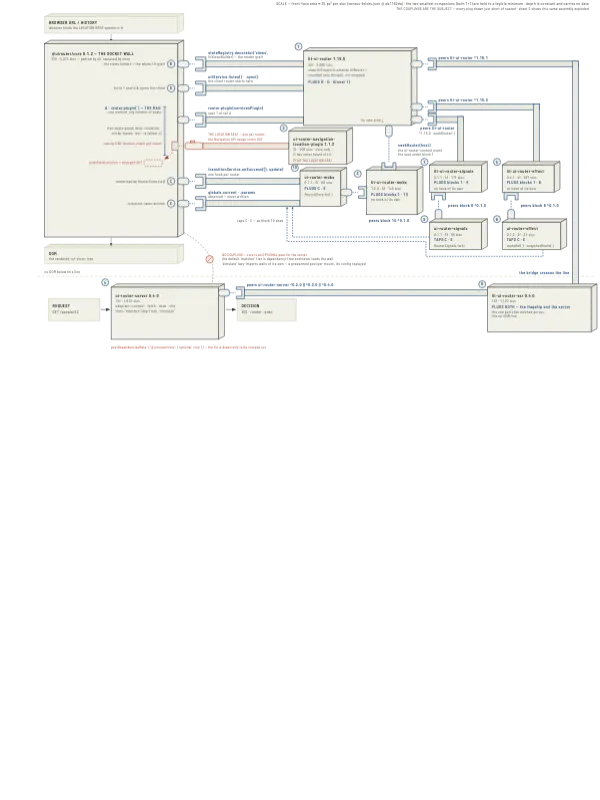
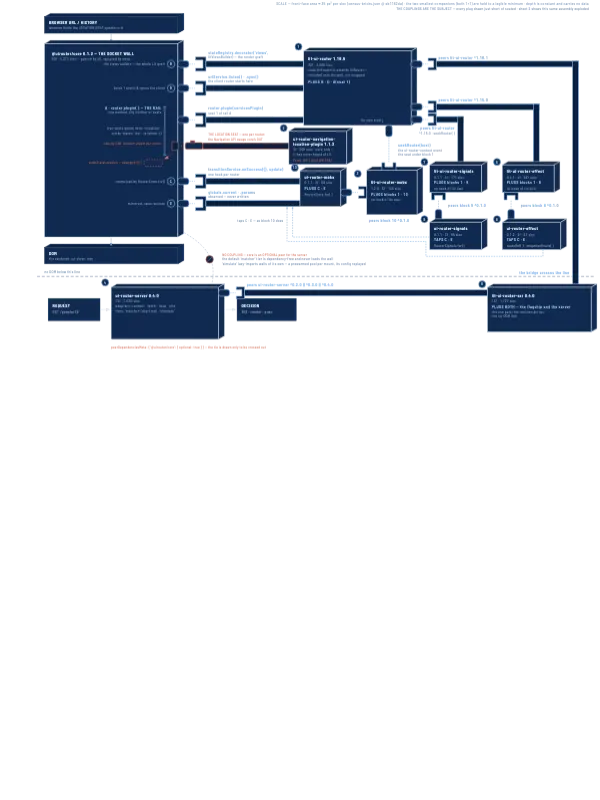
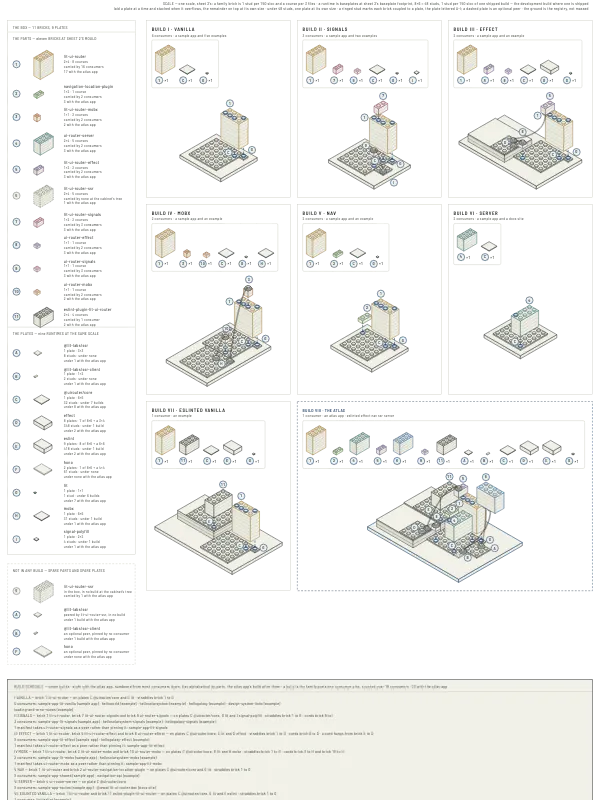
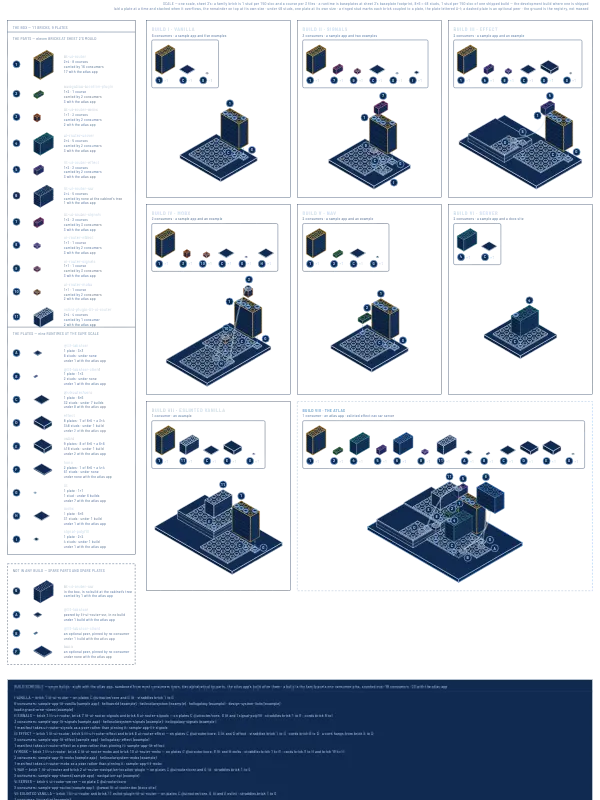
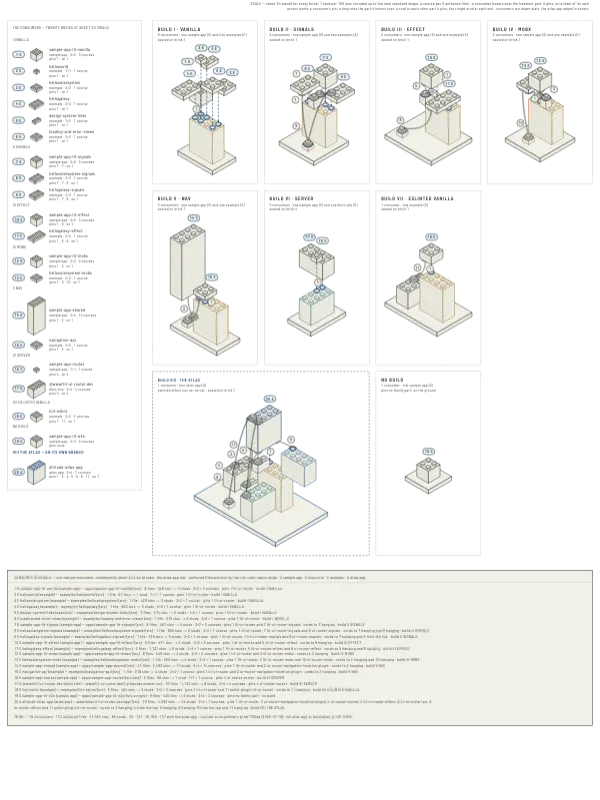
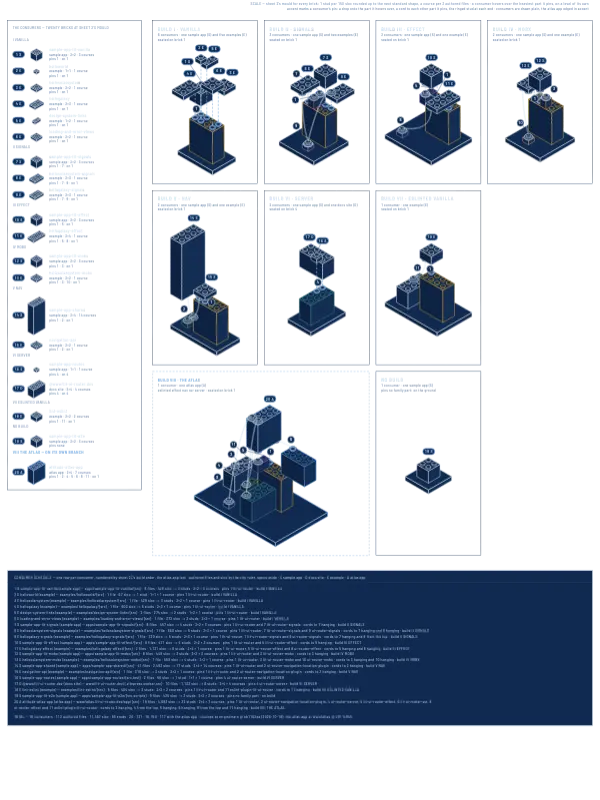
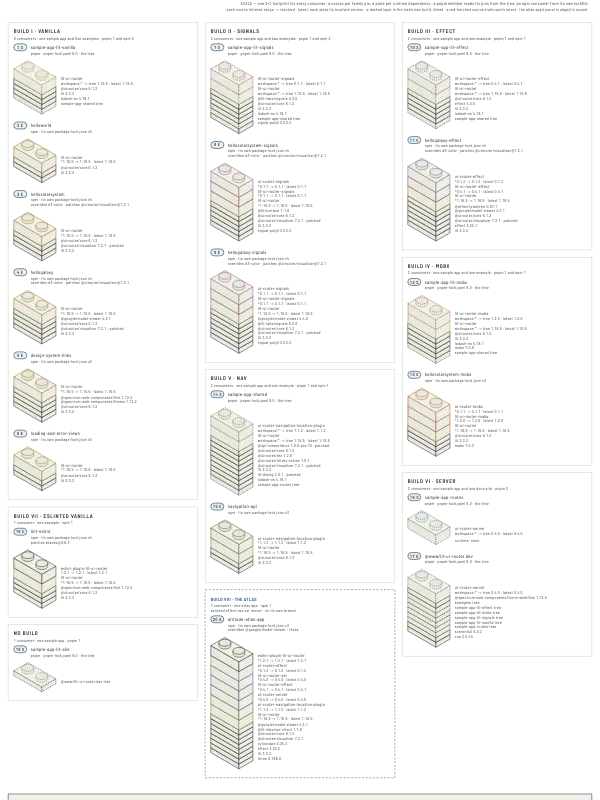
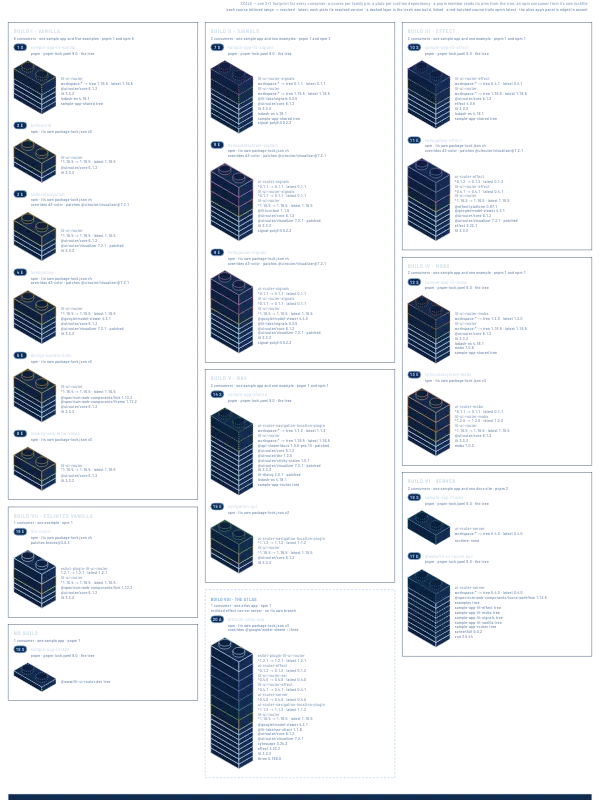
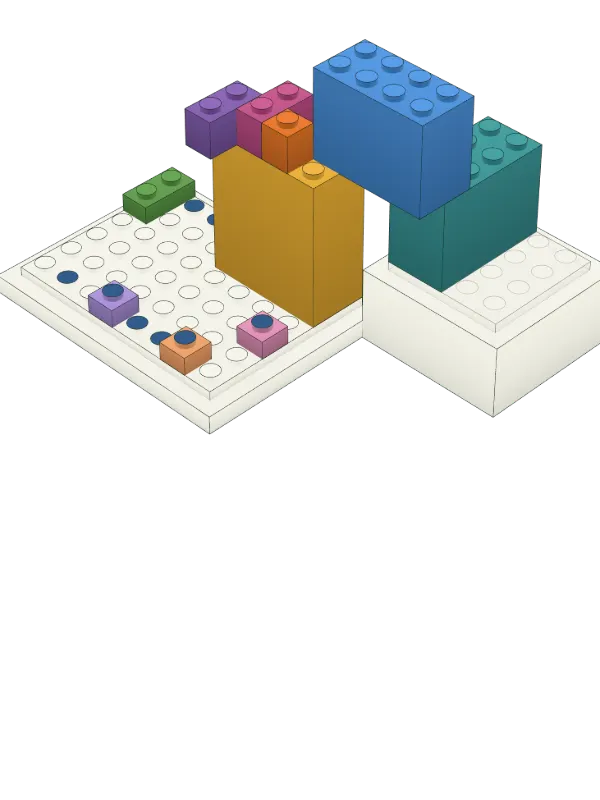
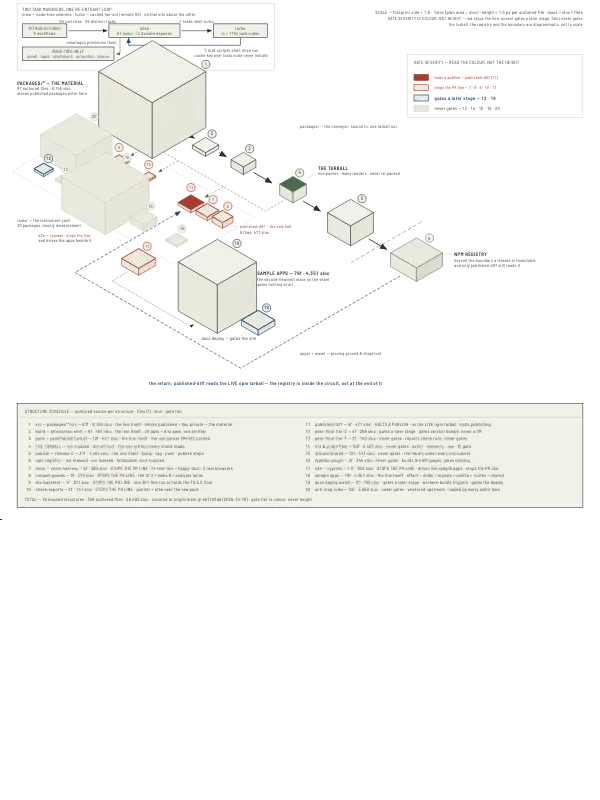
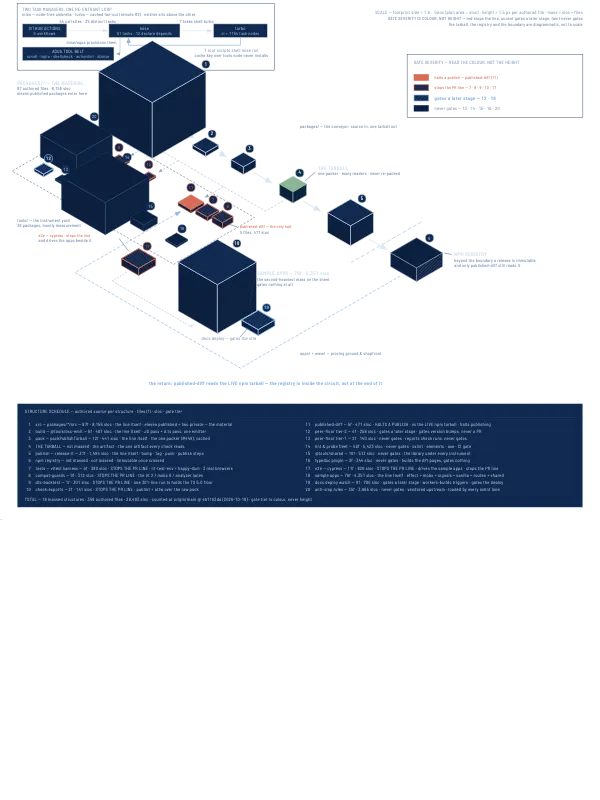
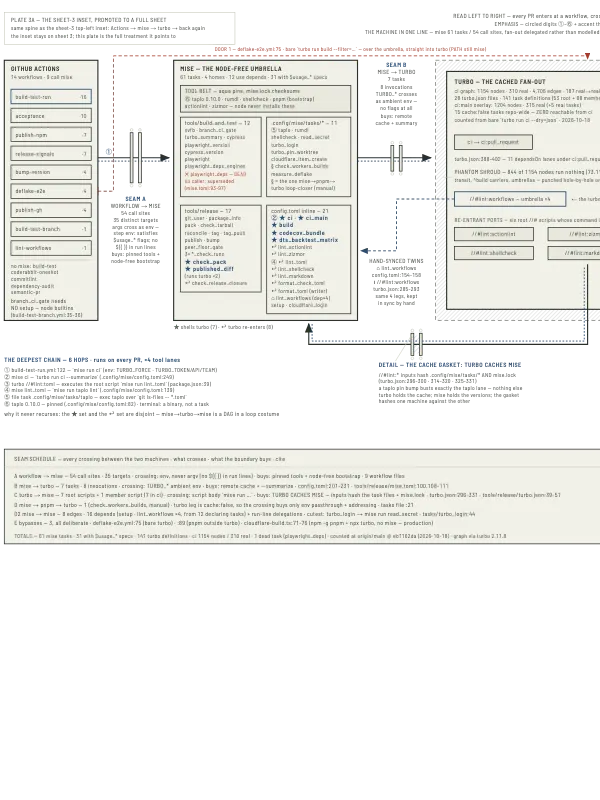
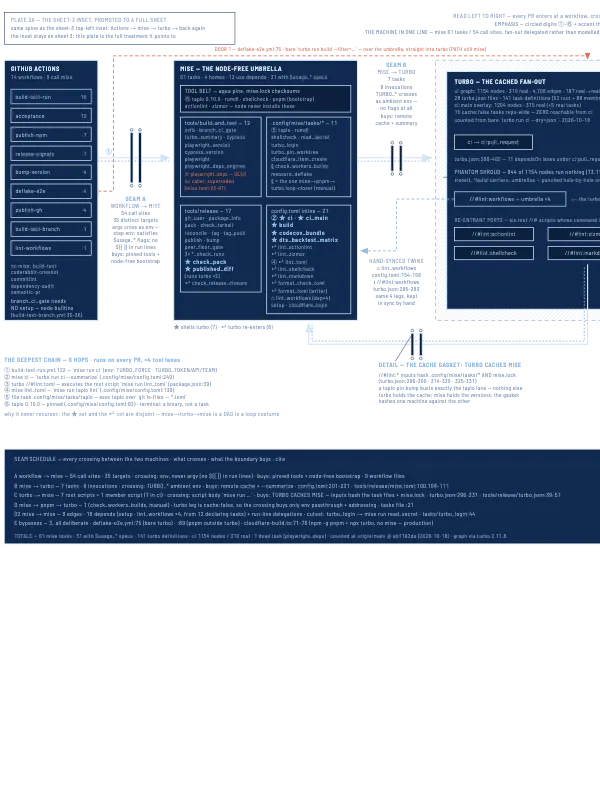
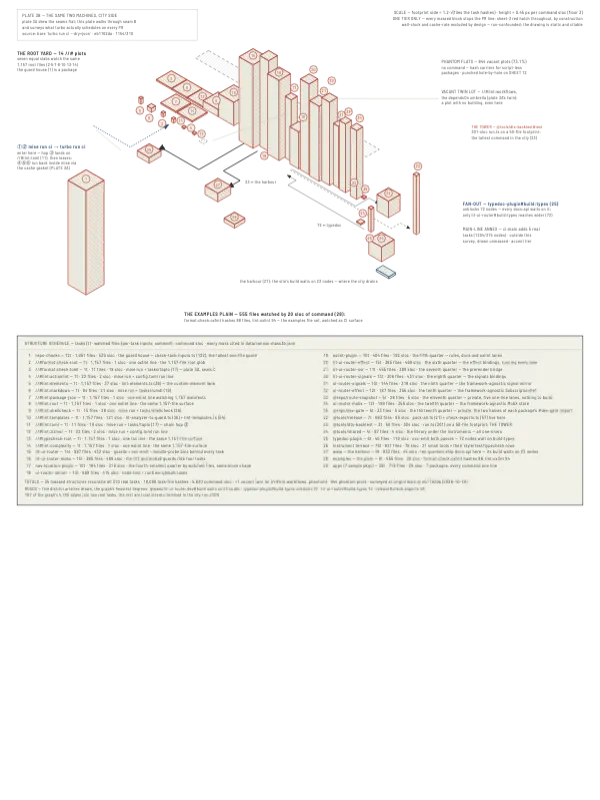
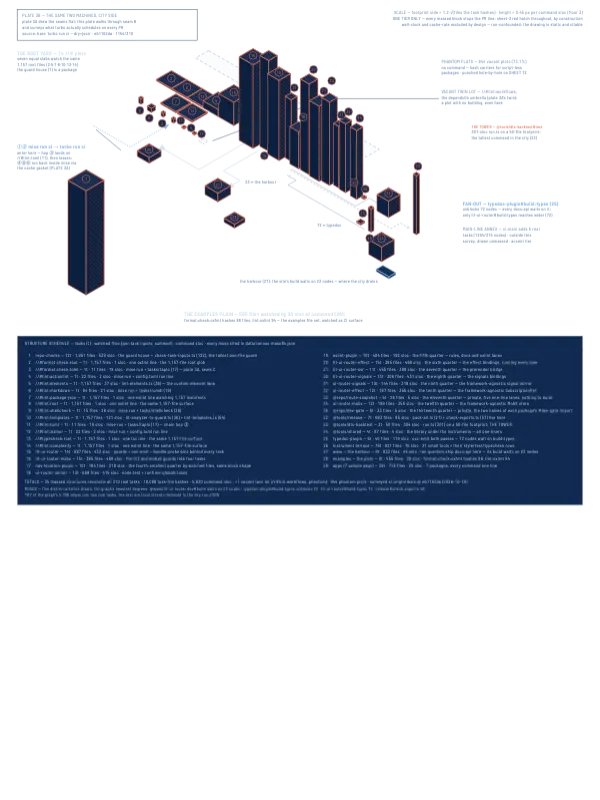
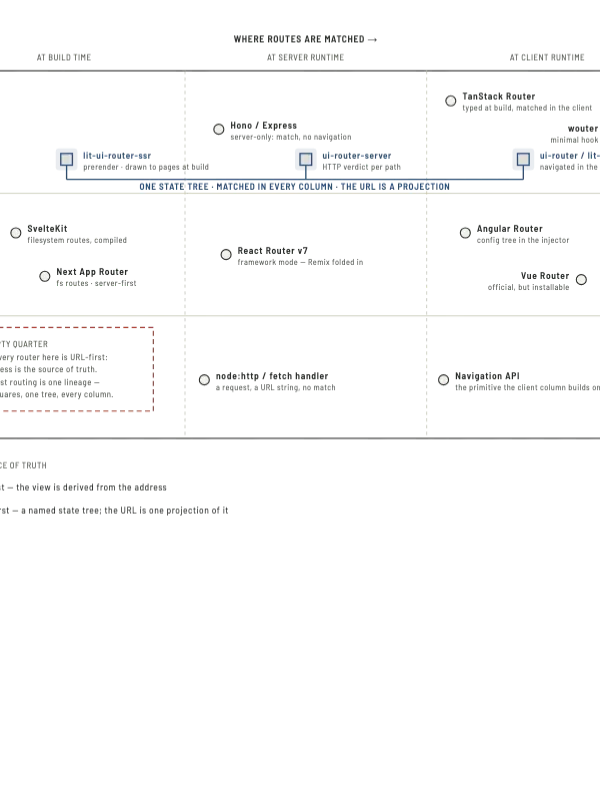
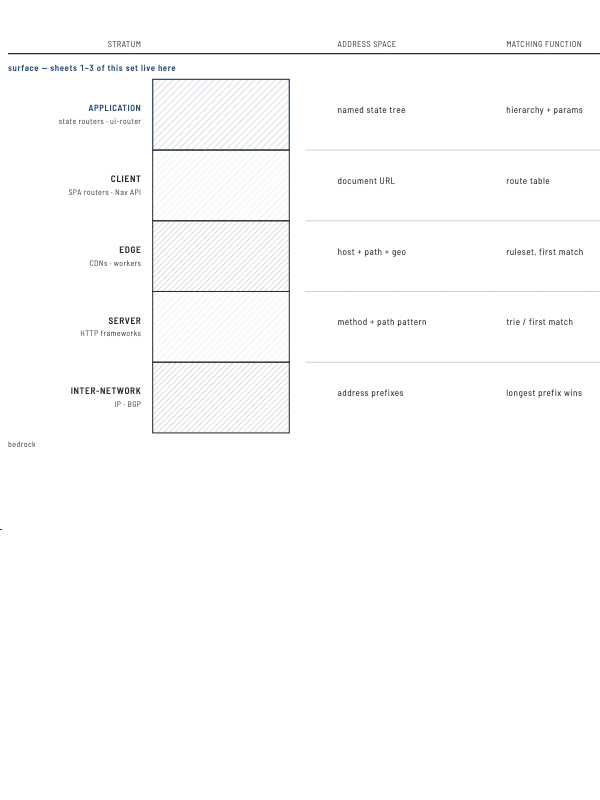
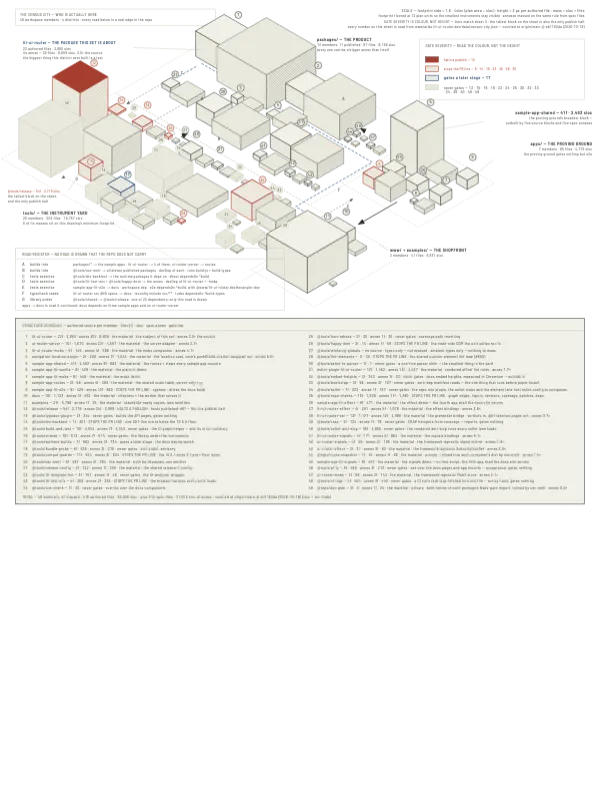
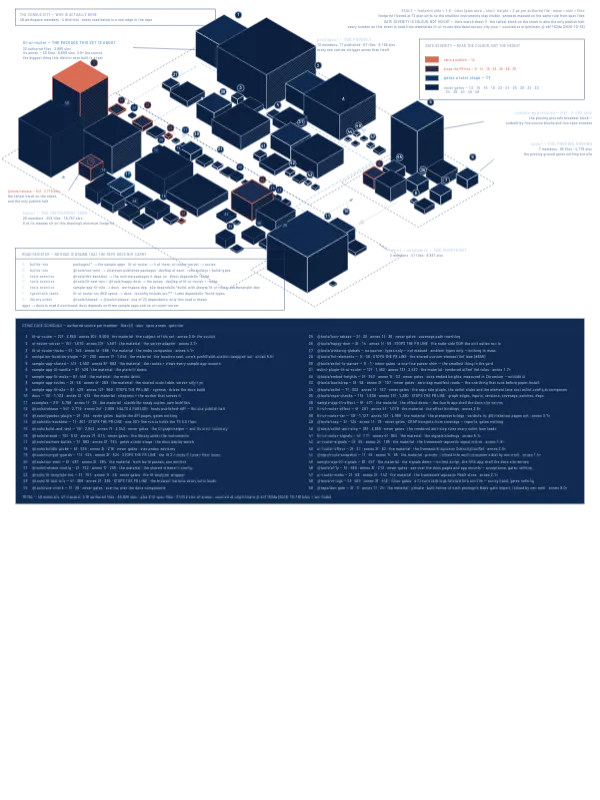
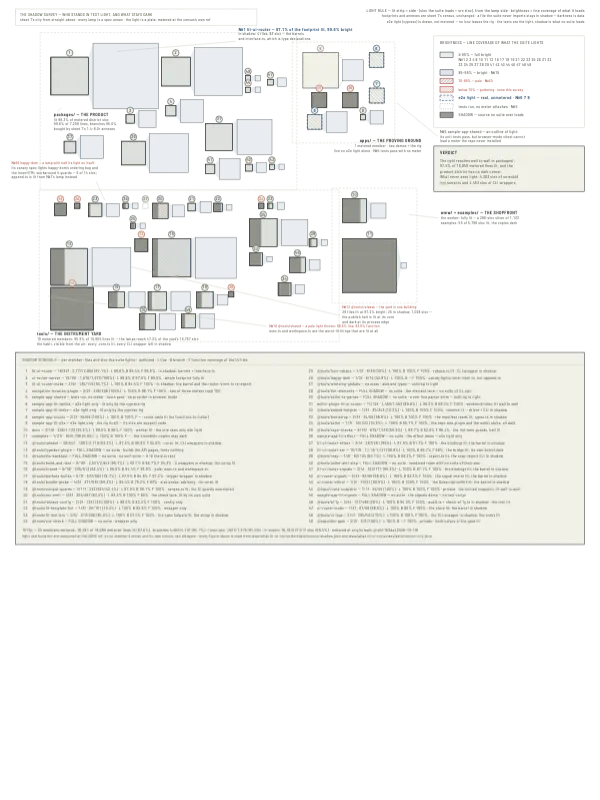
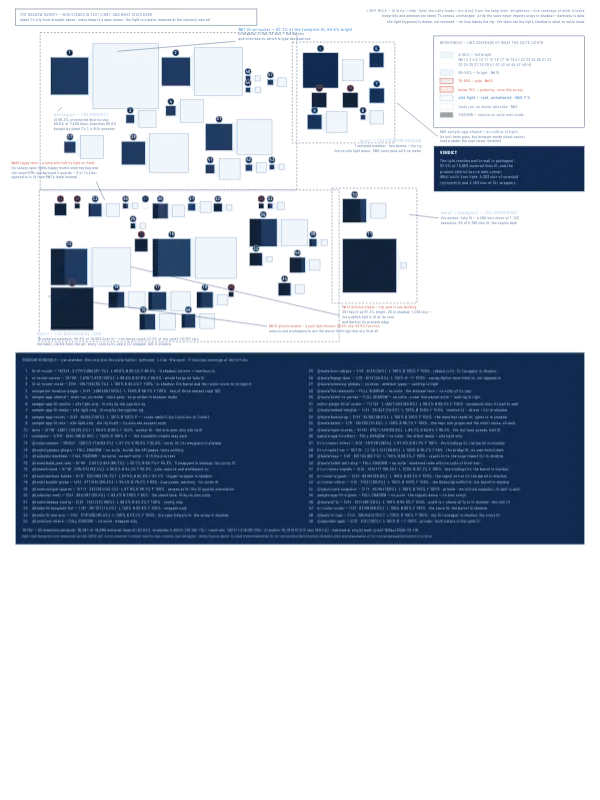
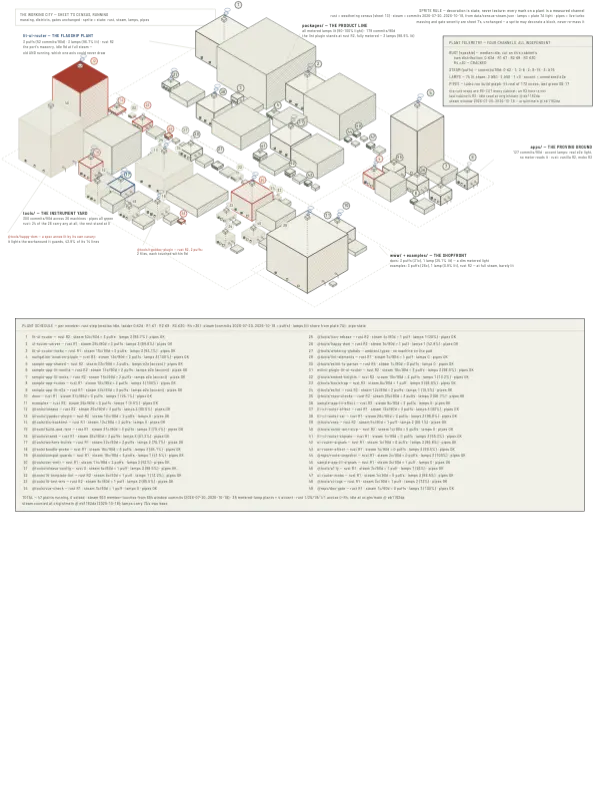
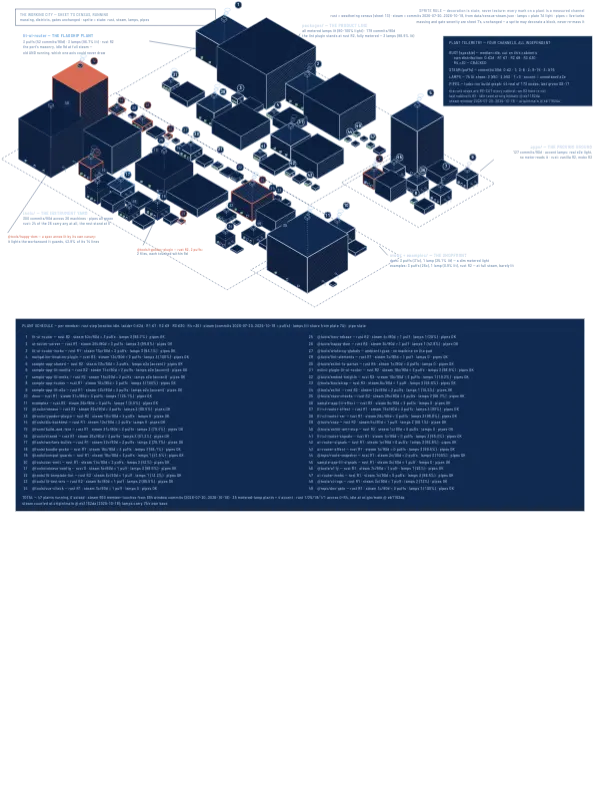
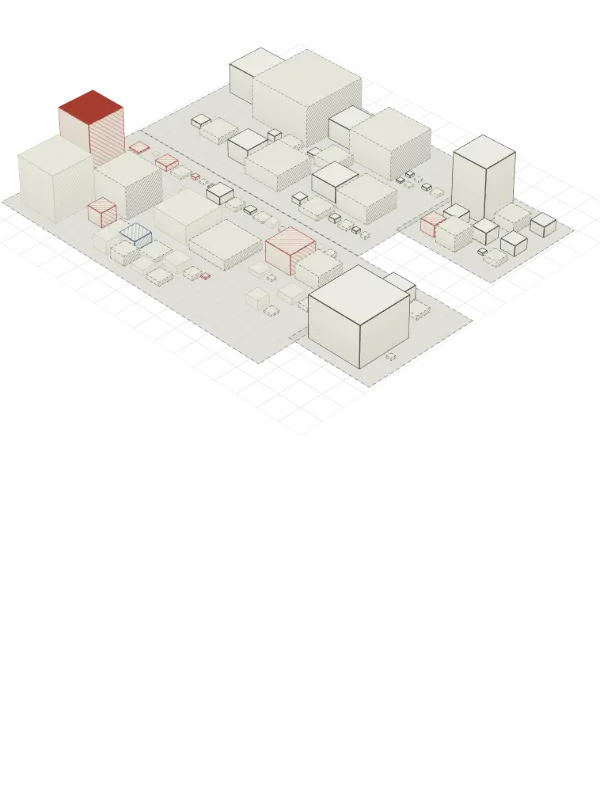
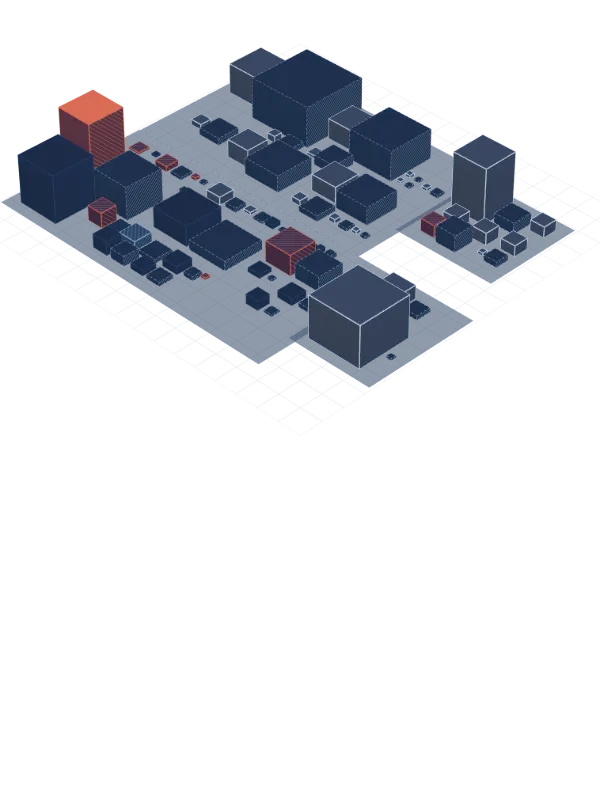
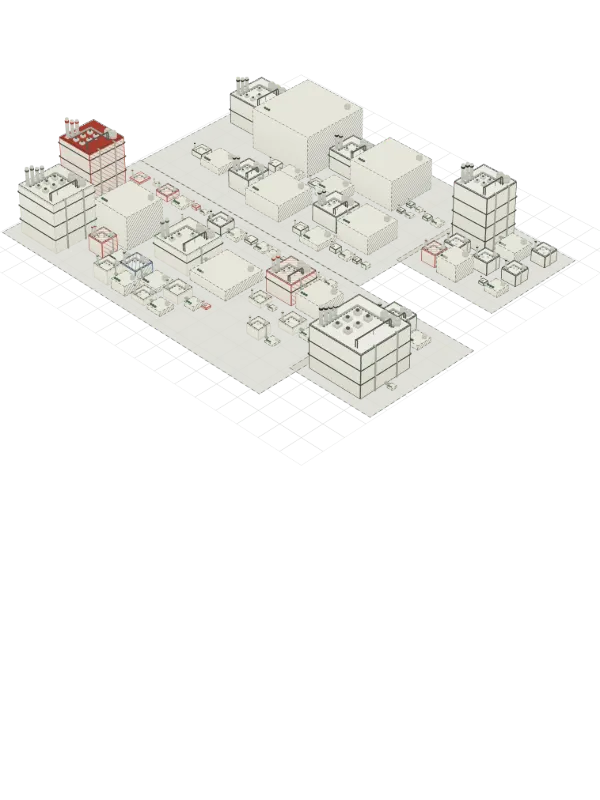
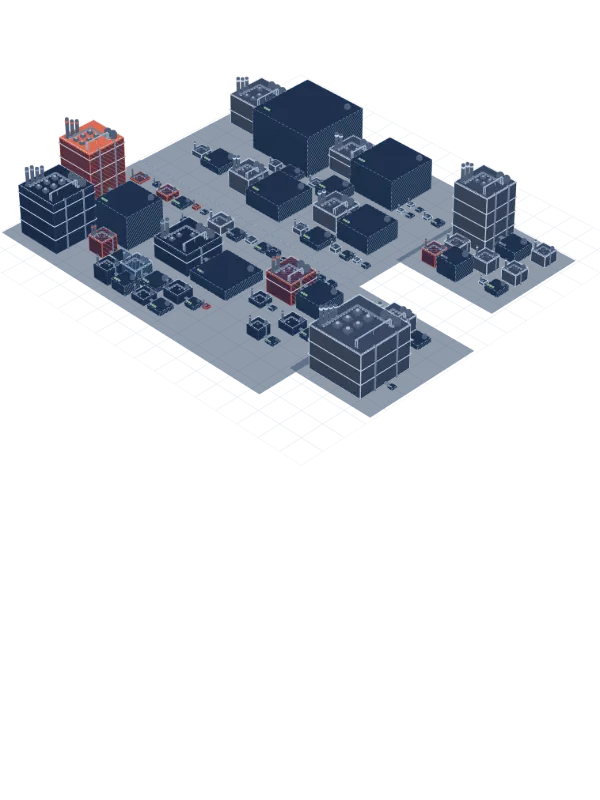
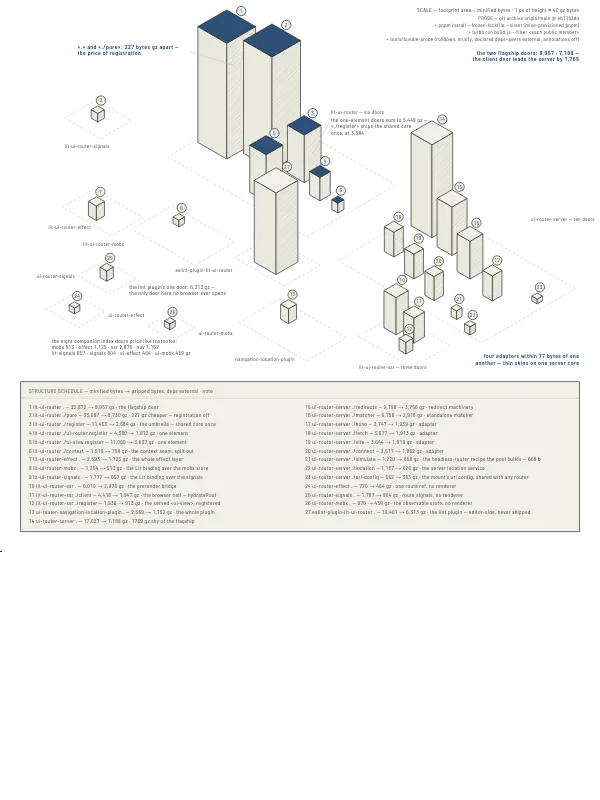
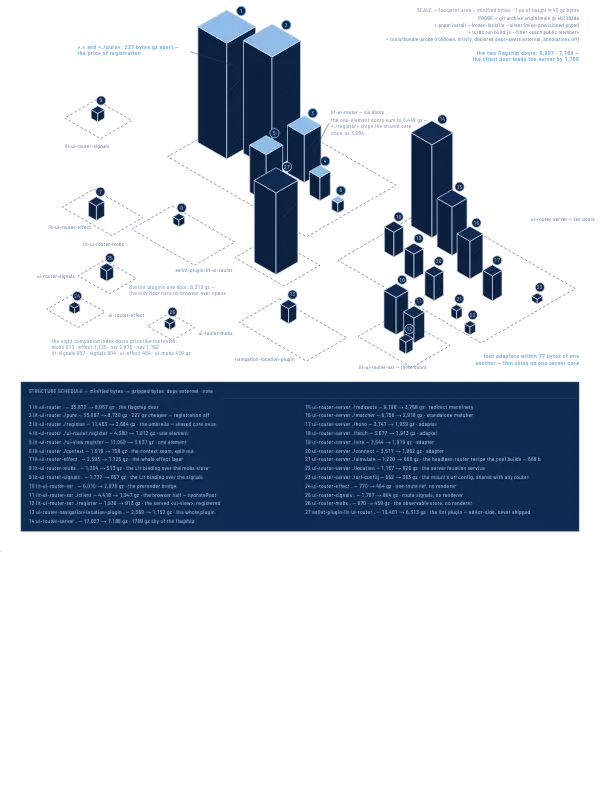
The source image — an isometric block city over a strategy-breeding harness — works because of three quiet decisions, and only one of them is the city: it maps roles in a mechanism rather than files; it spends its one visual scalar (height) on a true quantity; and it keeps a CONDITION field that says what is currently wrong. This set keeps those three decisions and lets everything else change with altitude.
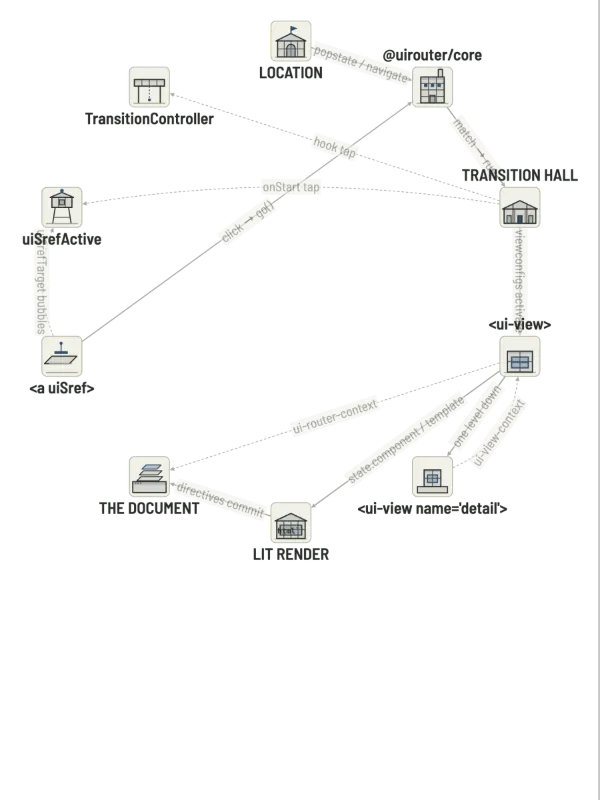
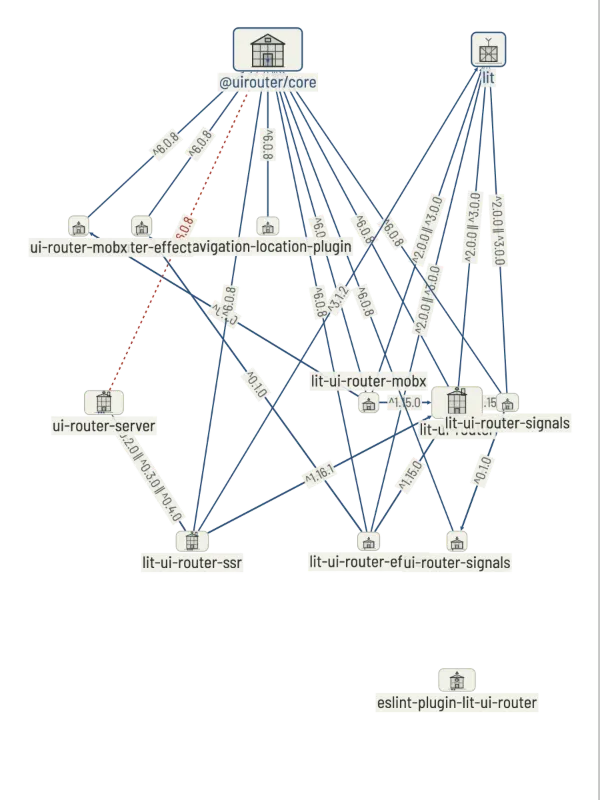
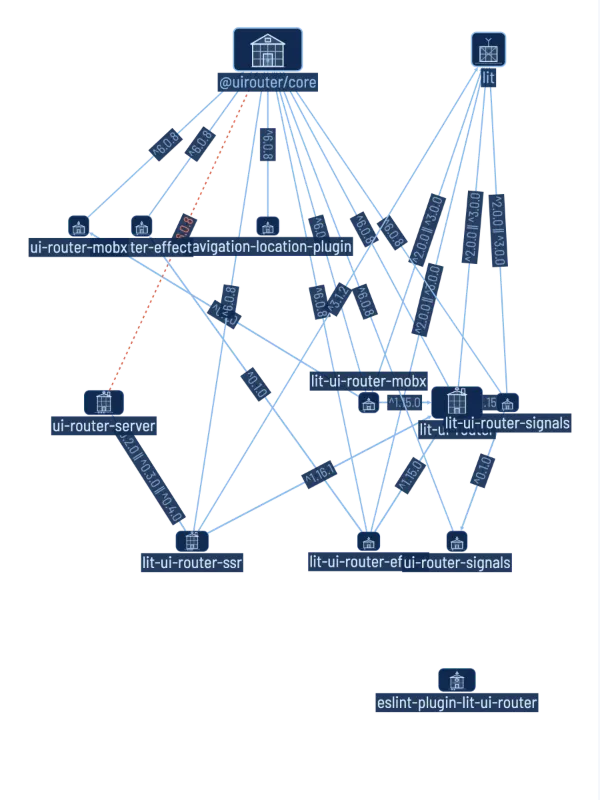
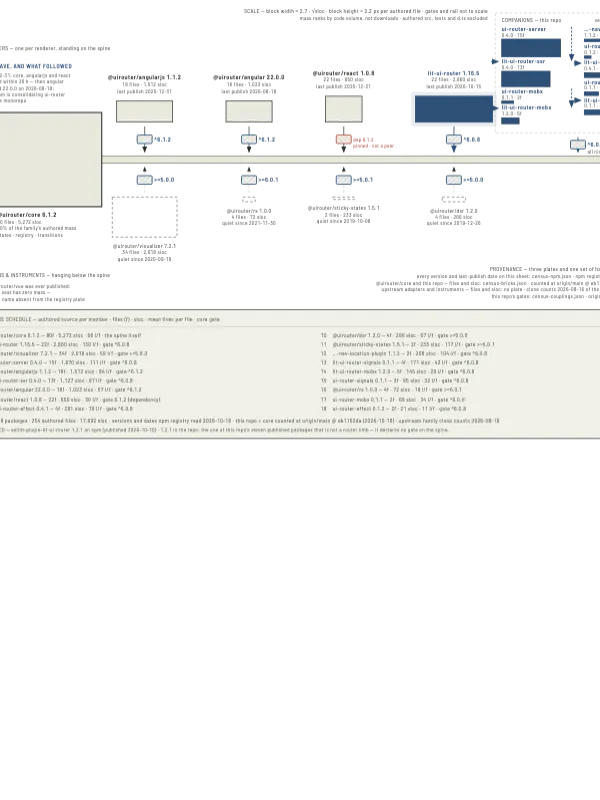
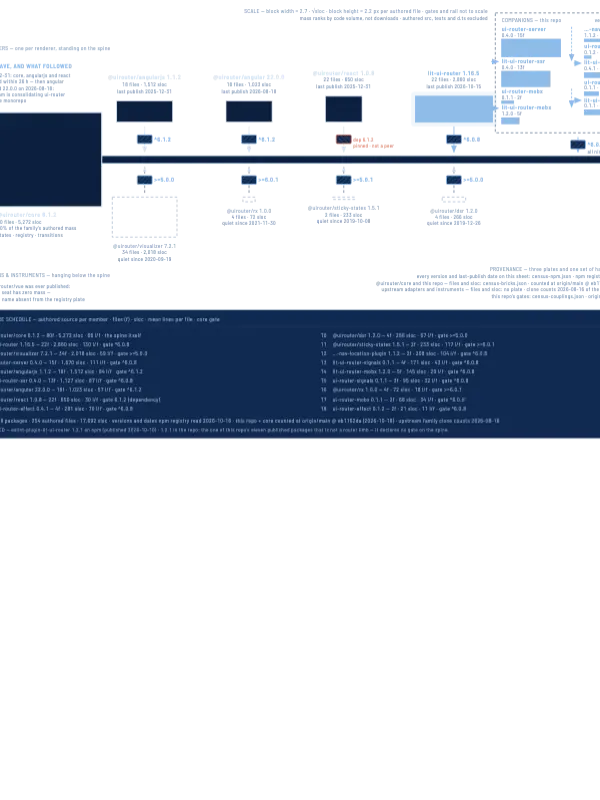
The result is an argument about form: a loop where there is a genuine cycle (sheet 1), panels where packages are too small to be cities (sheet 2), the full city where the measurement thesis is actually true (sheet 3), a massed spine where the family shares one core but the limbs never touch (sheet 4), a chart where edges would be fiction (sheet 5), and mostly prose where only a definition survives (sheet 6). Fitness peaks in the middle altitudes and collapses at both ends.
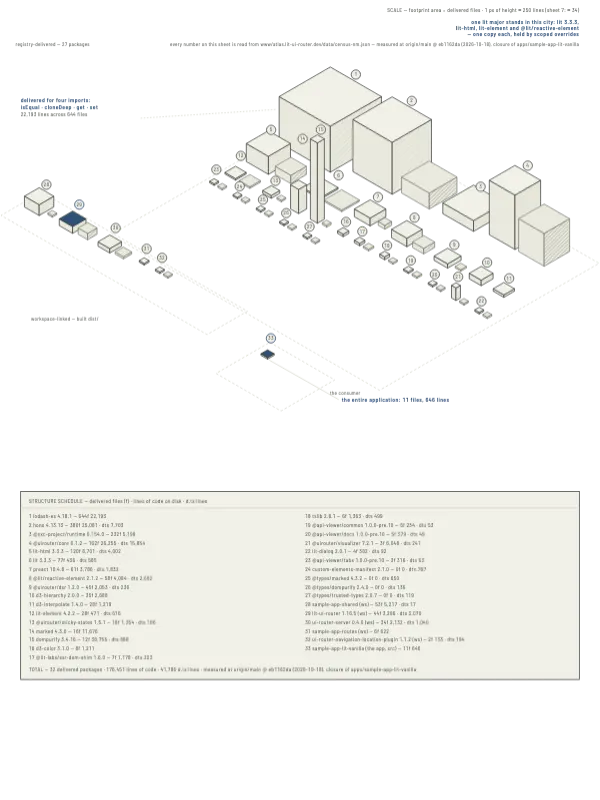
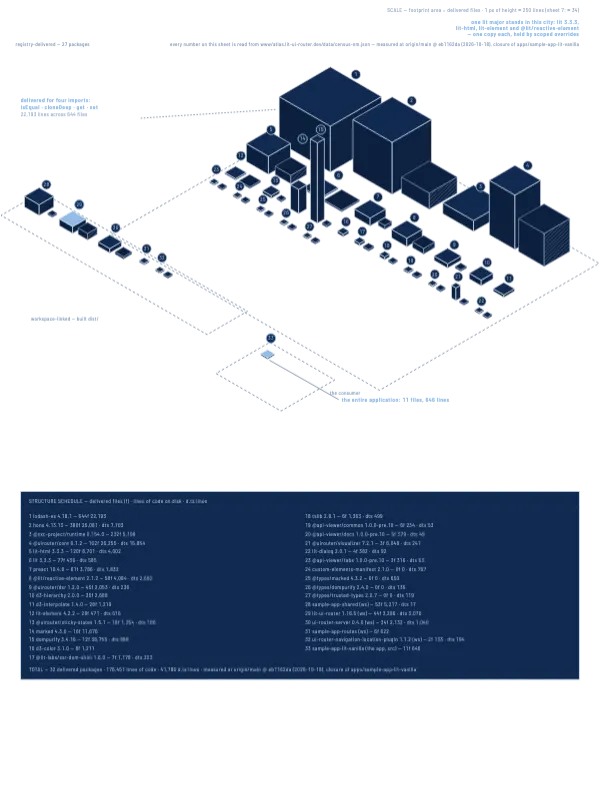
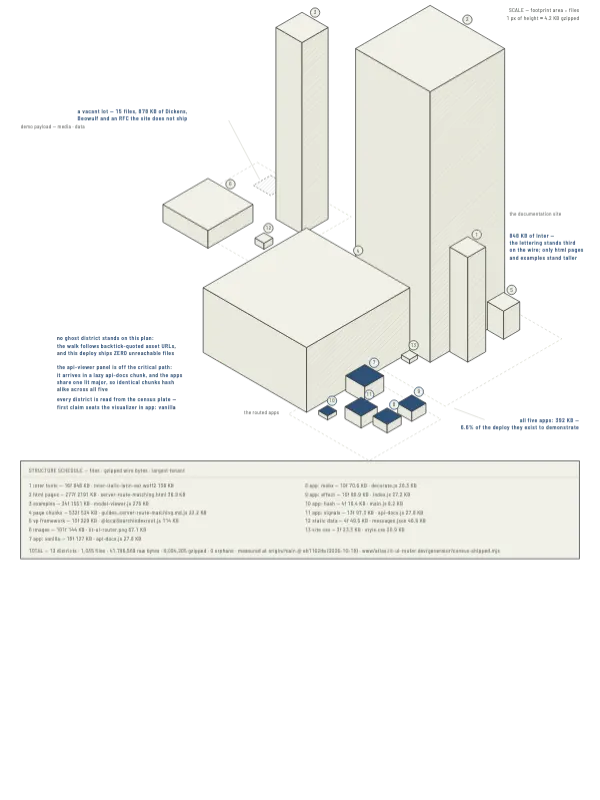
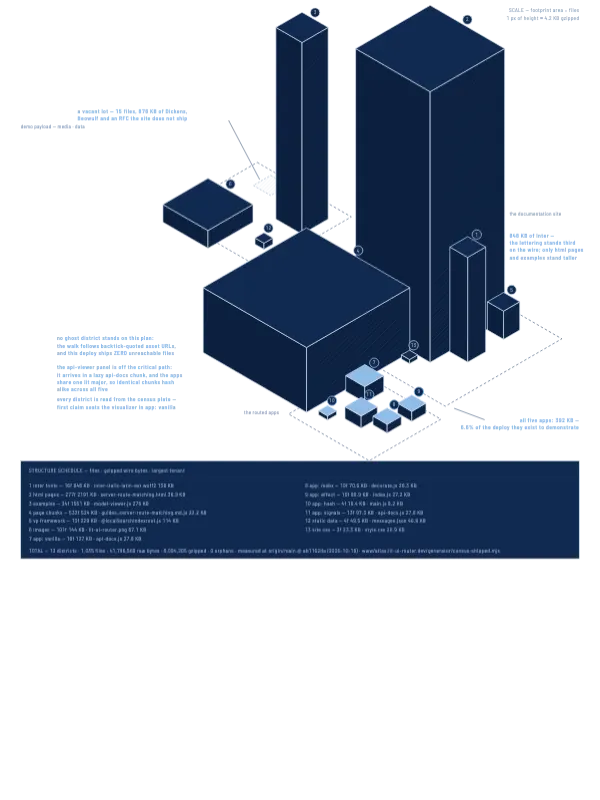
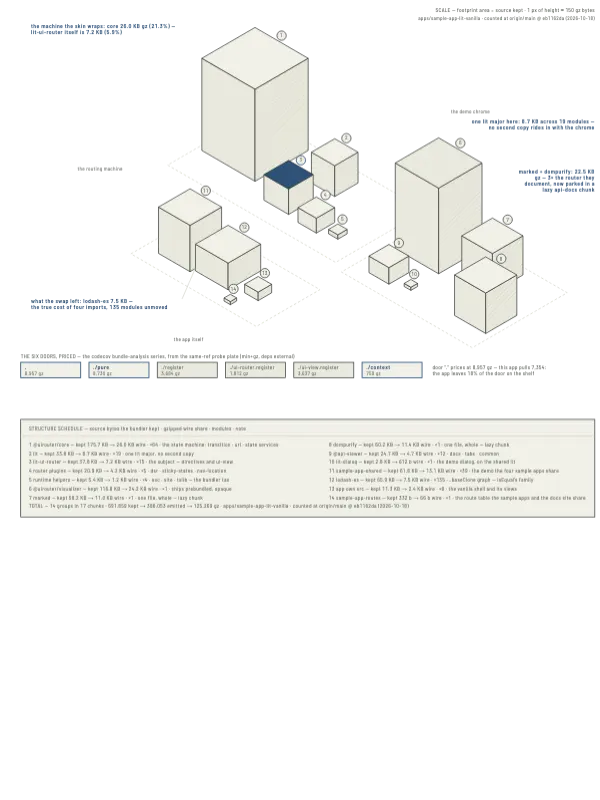
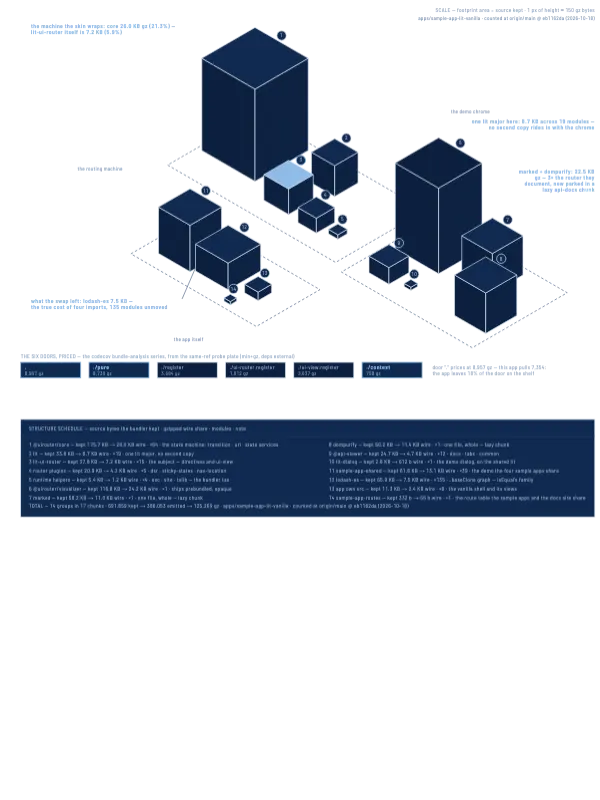
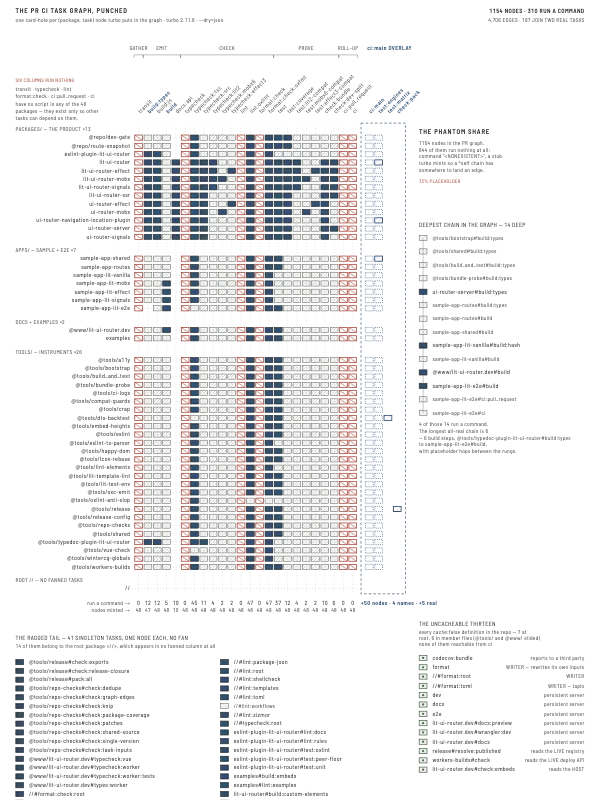
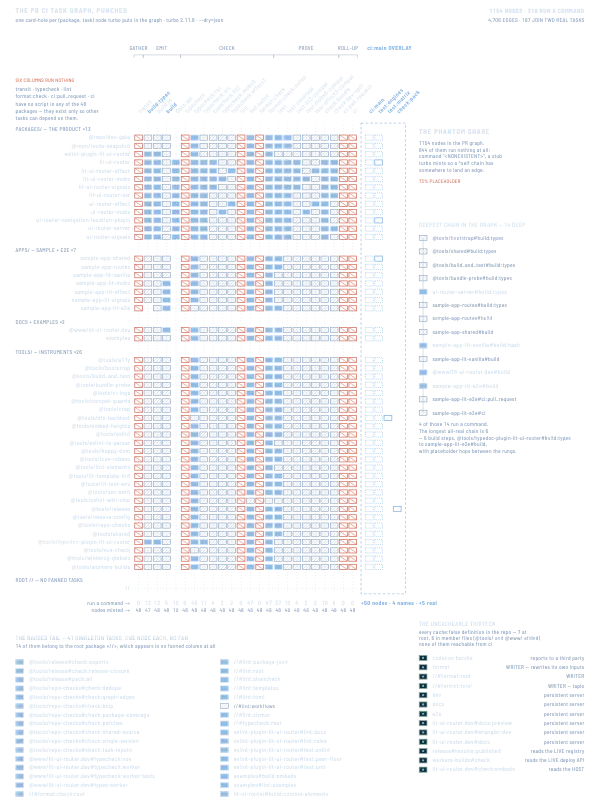
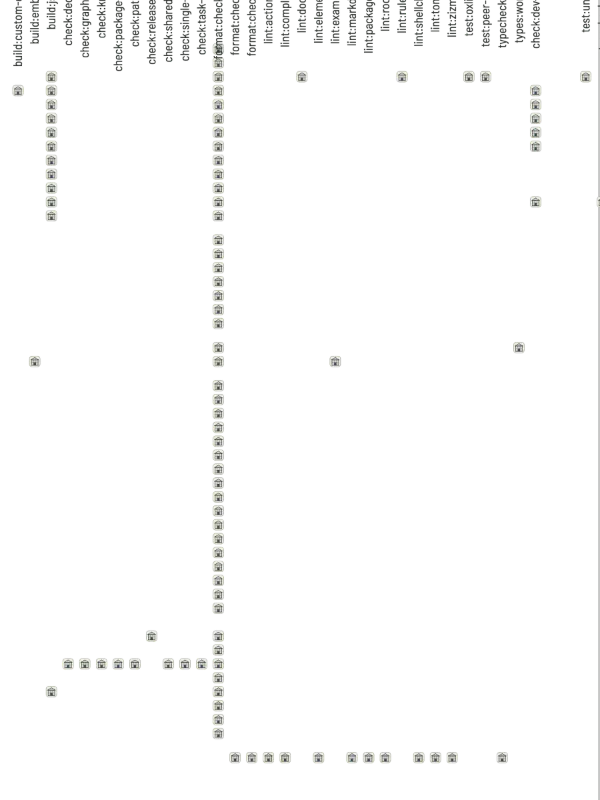
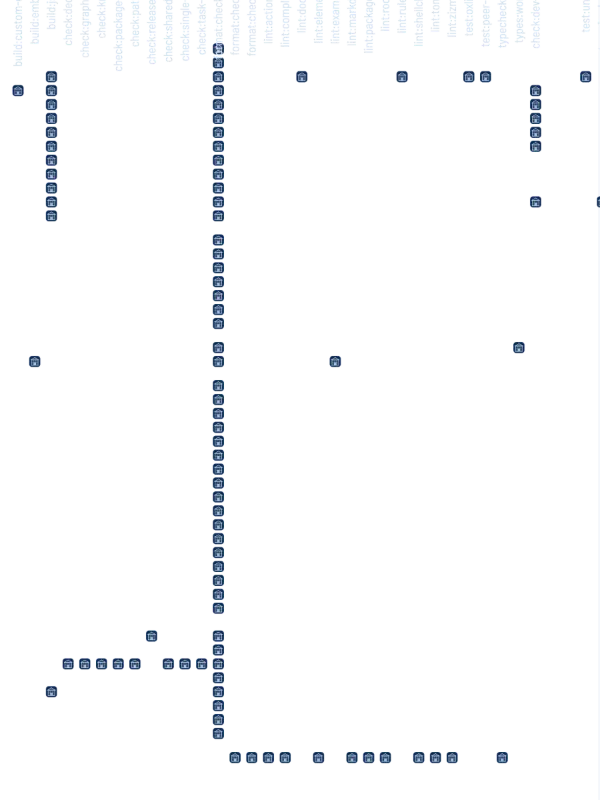
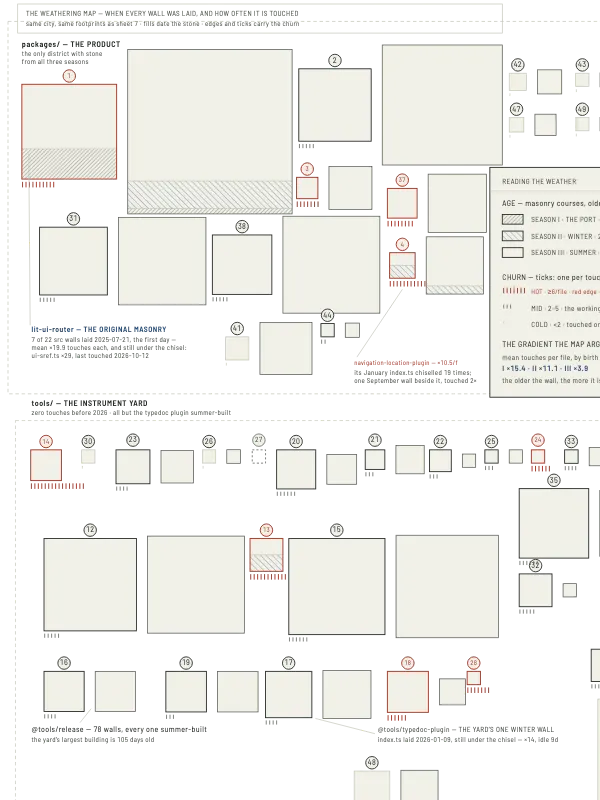
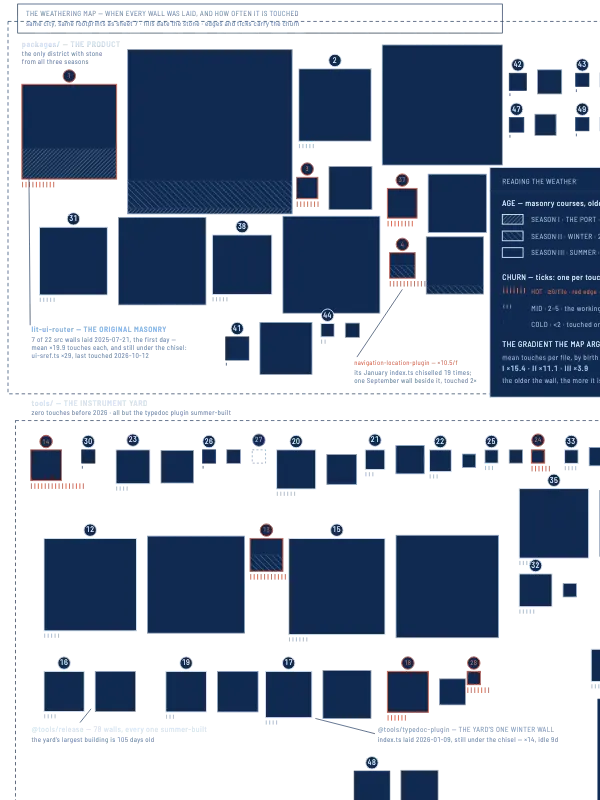
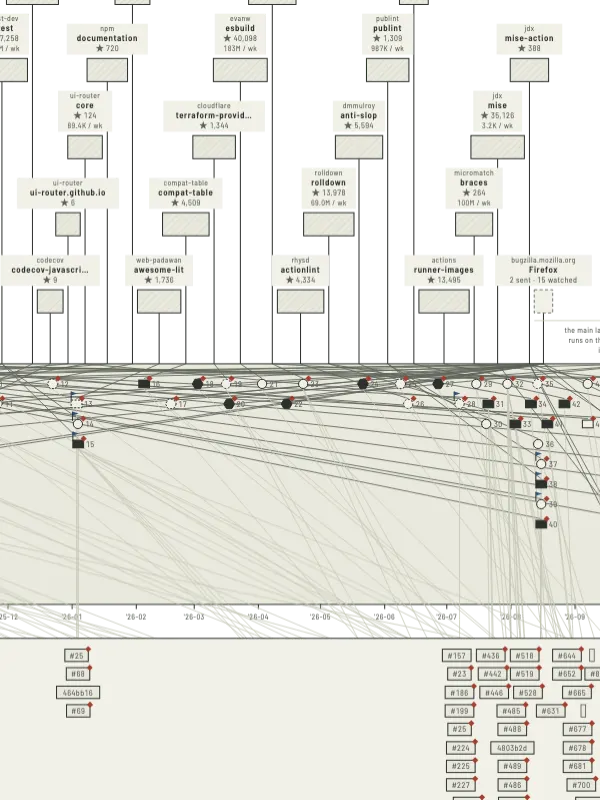
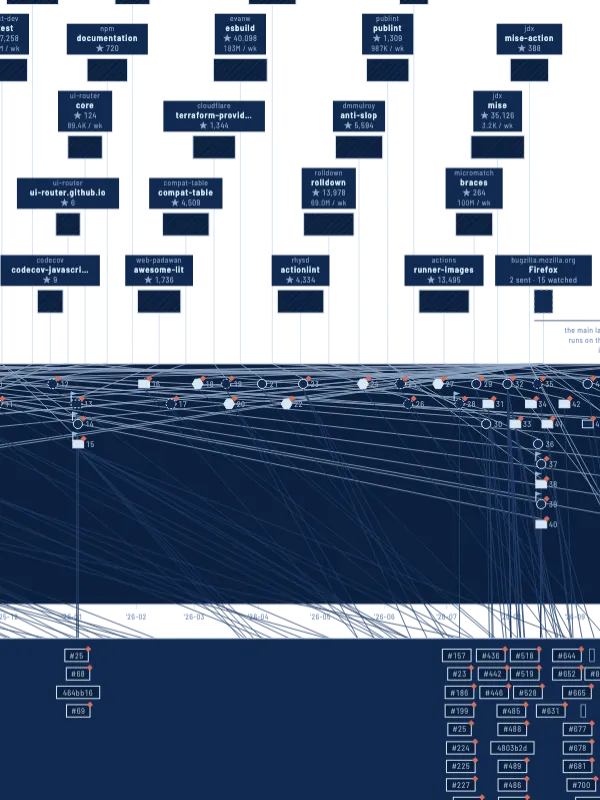
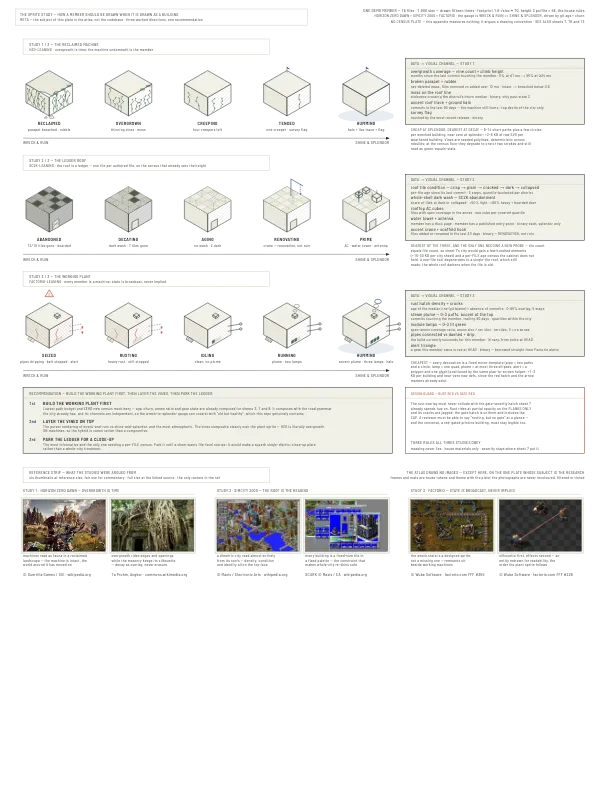
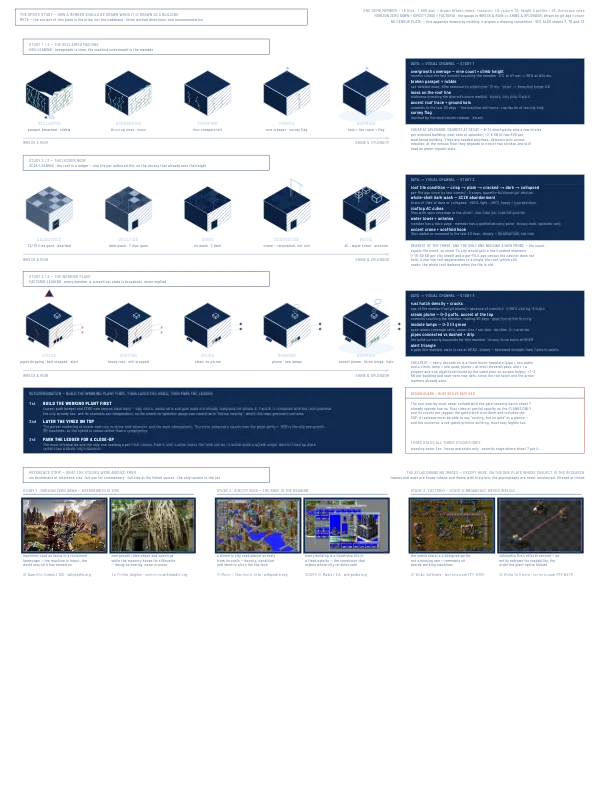
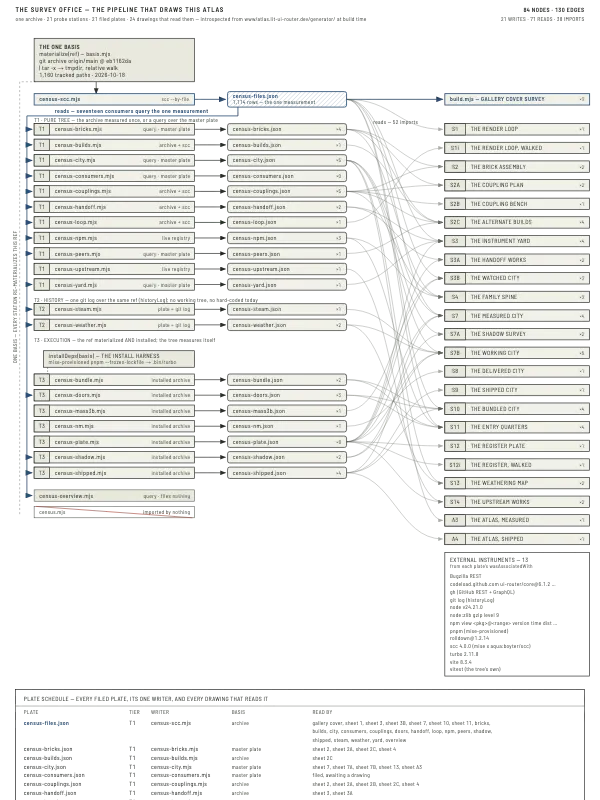
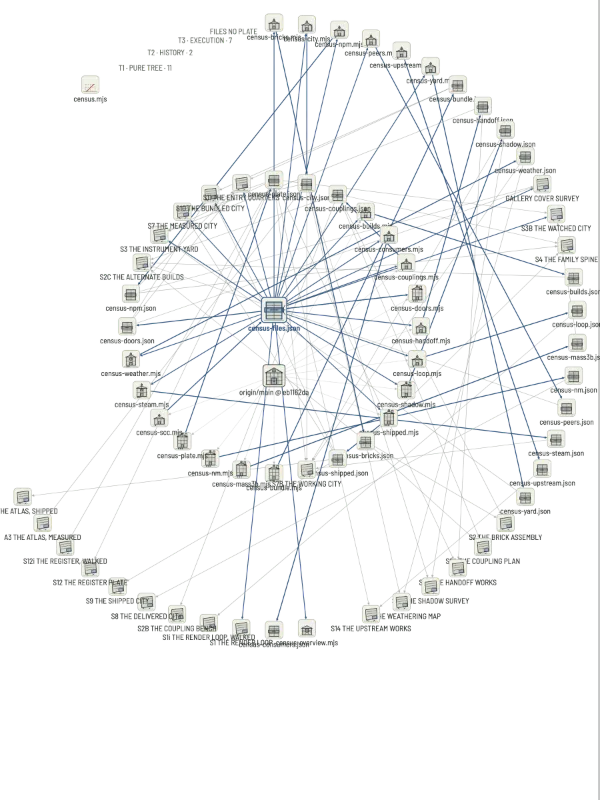
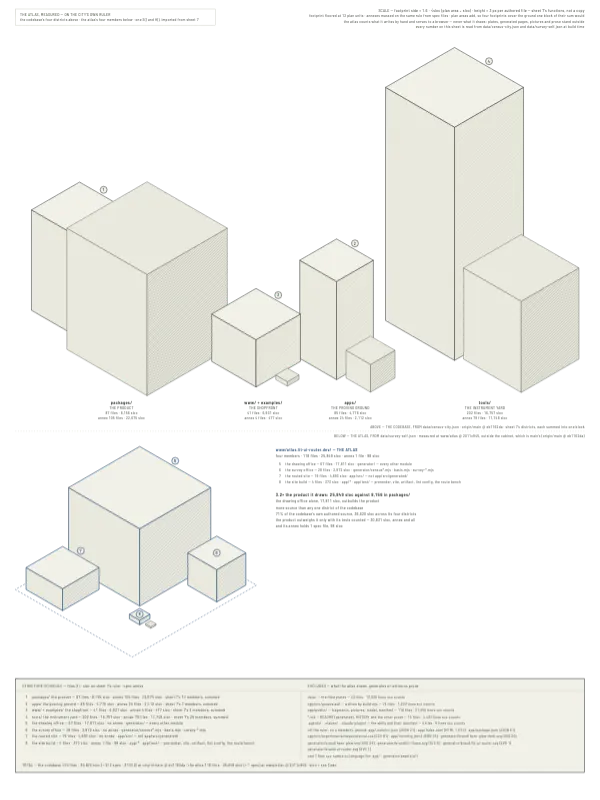
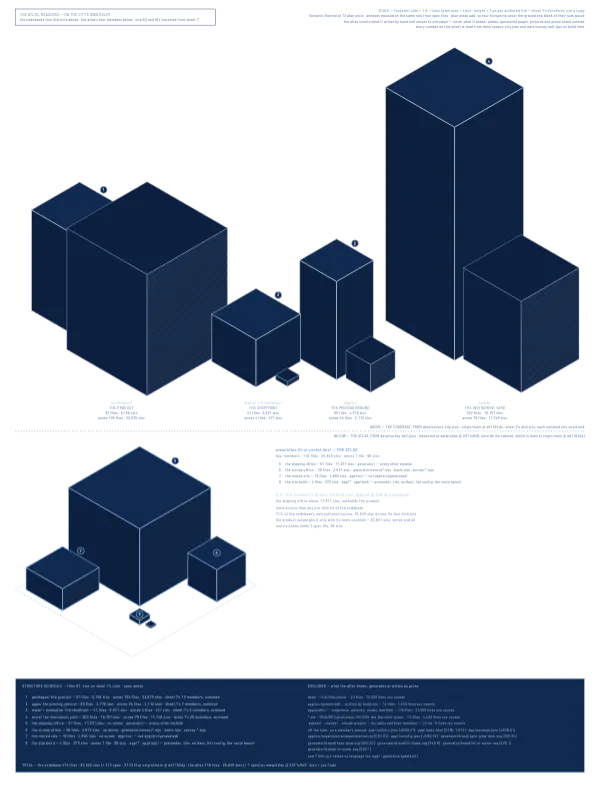
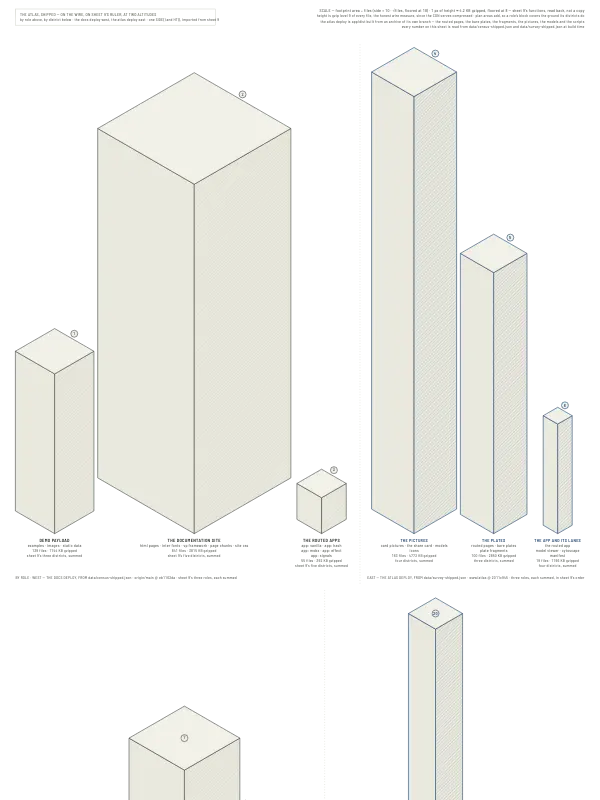
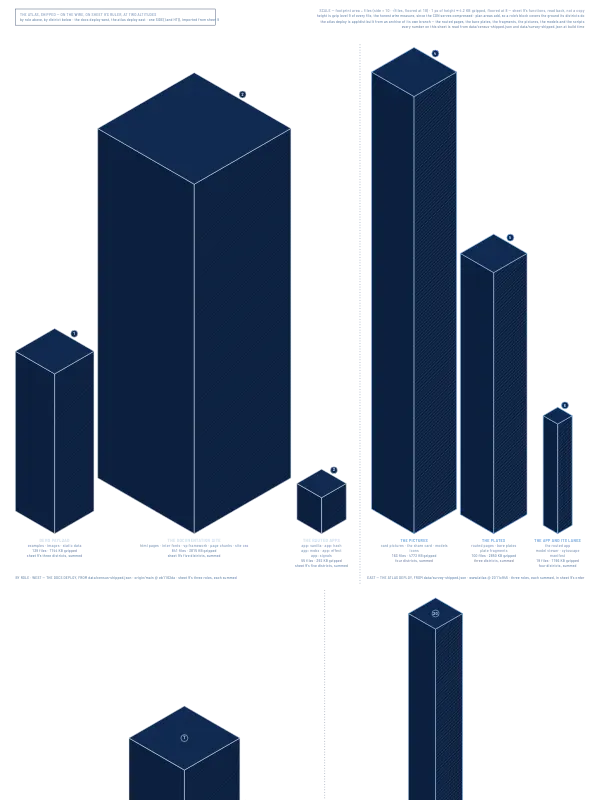
Above the sixth altitude the set stops arguing about form and starts measuring. Sheets 7–10 are a survey quartet, each counting the same subject at a different boundary: what the repository holds (the monorepo by mass), what npm delivers (the sample app's node_modules, 273× the app it serves), what the browser downloads (the docs deploy on the wire, where the prerendered prose tops the skyline and the lettering alone outweighs every routed app the site demonstrates), and who occupies the bytes after tree-shaking (the machine the router wraps is 21.3% of the bundle; the router itself, 5.9%). Sheet 11 cuts the same wire the other way, pricing 11 package quarters and 27 doors one at a time. Sheet 12 leaves the wire and draws the monorepo as its own CI reads it, the pull-request task graph punched onto a register plate. Sheet 13 ages the city by commit date, and sheet 14 draws it among the commons it builds on: the pull requests, issues and bug reports in other projects that its own record cites, sent or watched, and the home work that cites them. Interactive lanes (1i, 2B and 12i) walk the plates they sit beside, and the routed set stands sheets 2, 2C and 7 in the round. The appendix files plates whose subject is the atlas rather than the codebase: the sprite study behind the building sprites (appendix A1), and the survey office that turns the instrument on itself (appendix A2) — the census pipeline behind almost every number here, drawn as archive → probe stations → filed plates → drawings, introspected from the generator at build time, and walked live in its lane A2i. Appendix A3 turns sheet 7's ruler on the atlas itself: its drawing office, survey office, routed site and site build, massed beside the codebase they draw. Appendix A4 turns sheet 9's ruler on the atlas's own deploy: what the browser downloads from atlas.lit-ui-router.dev, district by district, beside the docs deploy summed by role.